

All projects

eToro

September 2024 · Mobile / Desktop

A cross-platform way to compare assets, markets, and Popular Investors before trading.

eToro Compare Charts experience

Overview

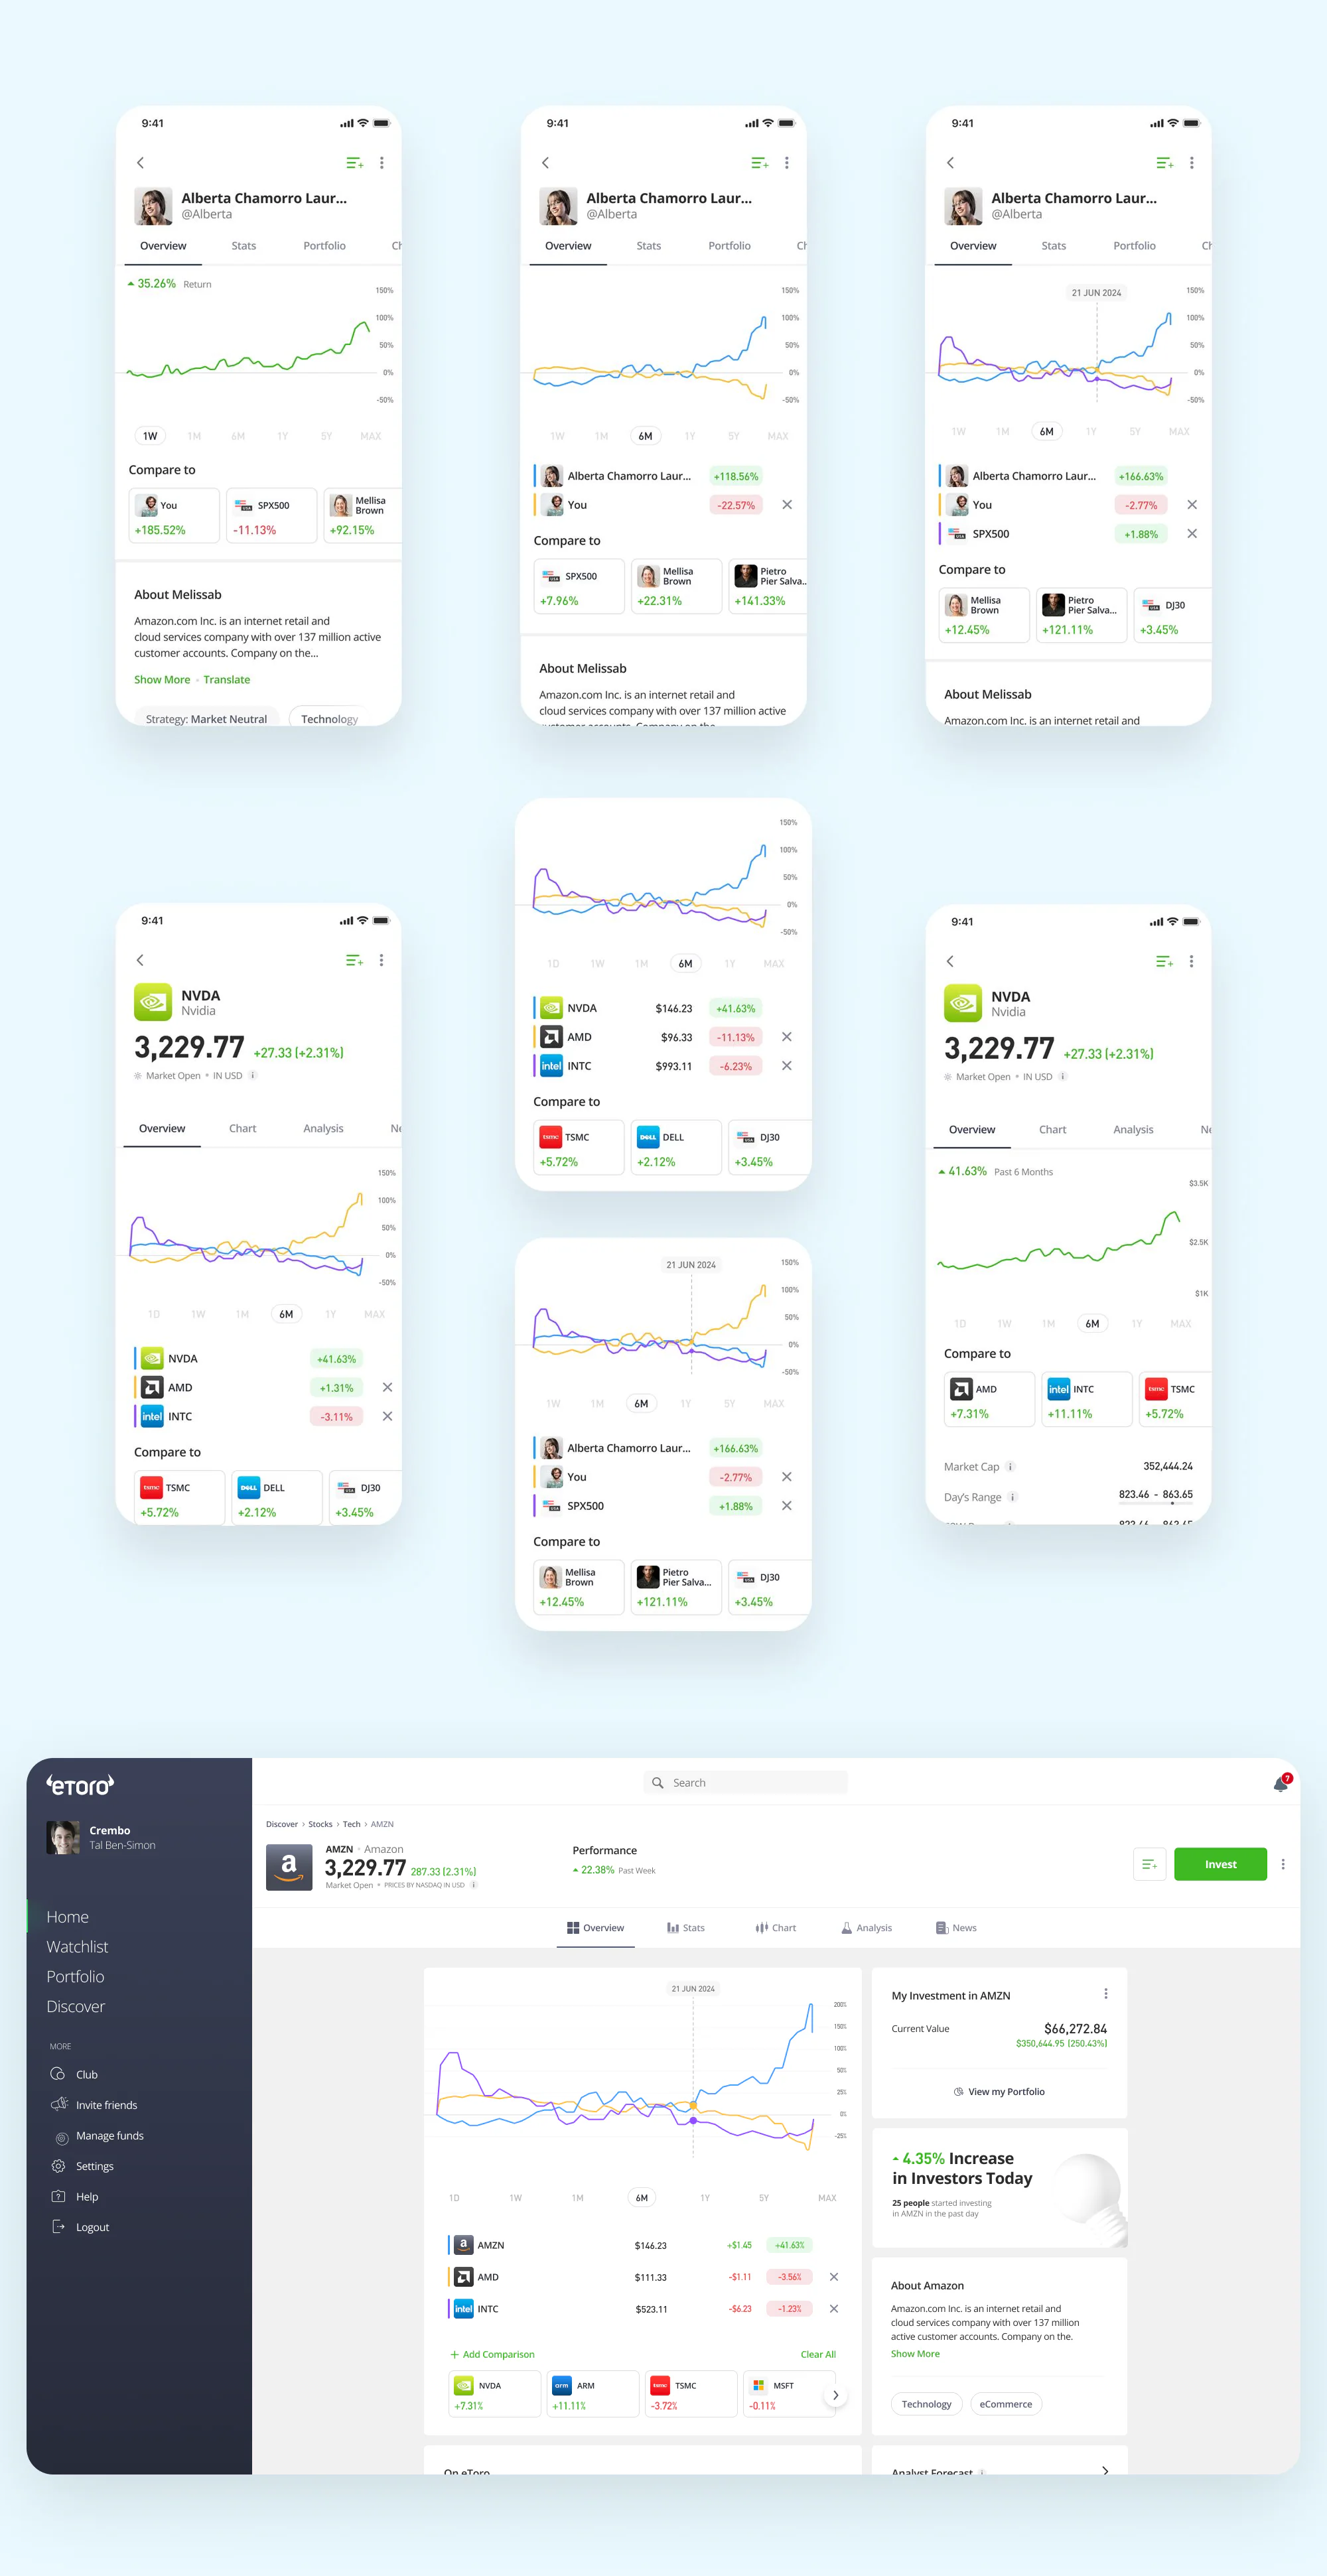
Comparison was already part of the trading ritual. The issue was that eToro did not own enough of it. Users moved out to compare assets, markets, and Popular Investors, then came back when they were ready to act. Compare Charts brought latest status, prices, performance, and investor benchmarks into one cross-platform workspace, so users could narrow options with a shared frame instead of scattered tabs. After launch, conversion to trade rose 32%, 54% of users held their positions beyond one month, and the improvements contributed more than $2.6M in annual revenue.

Role
Senior Growth Product Designer
My focus
Comparison model, recommendation-led defaults, and the cross-platform trading decision flow.
Evidence
  • More than 15 interviews and usability sessions with active investors, alongside Mixpanel and FullStory behavioral analysis across discovery and validation.
  • Opportunity Solution Tree analysis used to connect the decision problem to potential product directions.
  • Competitive review of asset-comparison products and common market-research patterns.

Process and solution

Research and decision context for eToro Compare Charts

The decision was leaking out of the product

More than 15 interviews and usability sessions showed that comparison was already part of the trading decision, but much of it happened outside eToro. The problem was not a lack of options. Users needed a manageable way to evaluate assets, markets, and Popular Investors with the same rules.

The Opportunity Solution Tree work framed the issue as a paradox of choice. Showing more opportunities would not help unless the product also helped users compare fewer, more relevant alternatives.

Default to relevance

The workspace compared assets, markets, and Popular Investors in one view. An existing model used portfolio holdings, related or uncorrelated assets, and recent views to suggest a useful starting set.

That same surface gave strong Popular Investors a clearer way to show performance against benchmarks, turning comparison into both a decision tool for traders and a credibility signal for investors.

The important part was not simply showing more data. It was giving users a consistent basis for saying yes, no, or not yet.

Compare Charts objectives and personalized comparison model

Key decision

Reuse the existing machine-learning recommendation algorithm instead of building full search and manual selection for the first release.

A manual selector offered more control but required substantially more development. Reusing a model already in production let the team ship sooner with recommendations based on portfolio and browsing signals.

Alternative considered: Design and build a new search-and-select system for constructing every comparison manually.

Outcome

+0%

Conversion to trade

0%

Positions held beyond one month

$0M+

Annual revenue contribution

Organic sharing

Community behavior

Looking ahead

Add search and manual selection, then compare their use with the recommended starting sets.